Global Real Estate Transparency Index 2016 : 109 Countries by Tier
•
1 like•1,464 views

JLL’s Global Real Estate Transparency Index quantifies transparency based on 139 variables relating to transaction processes, regulatory & legal frameworks, corporate governance, performance measurement and data availability. Higher real estate transparency is associated with stronger investor & corporate real estate activity. To find out more about JLL's Global Real Estate Transparency Index 2016, visit http://www.jll.com/transparency
Recommended

Recommended
More Related Content
More from JLL
More from JLL (20)
Recently uploaded
Recently uploaded (20)
Global Real Estate Transparency Index 2016 : 109 Countries by Tier
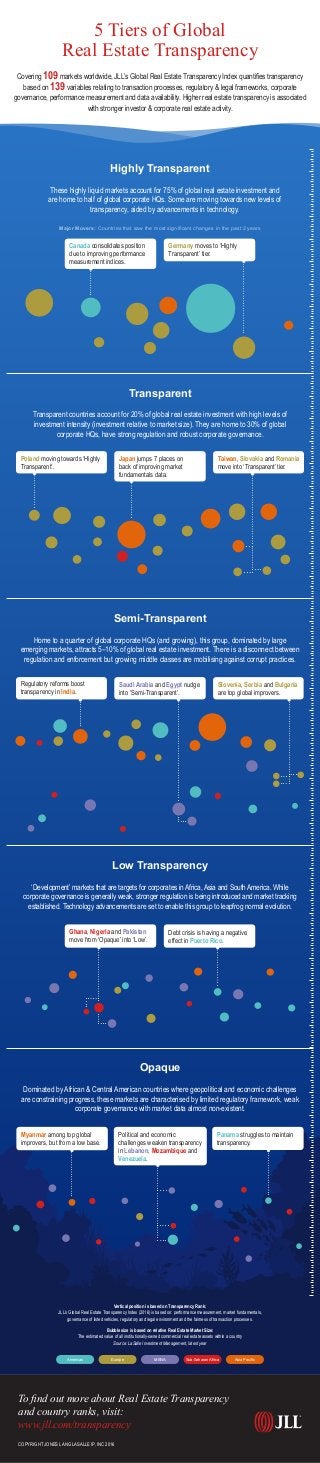
- 1. 5 Tiers of Global Real Estate Transparency Covering 109 markets worldwide, JLL’s Global Real Estate Transparency Index quantifies transparency based on 139 variables relating to transaction processes, regulatory & legal frameworks, corporate governance, performance measurement and data availability. Higher real estate transparency is associated with stronger investor & corporate real estate activity. Canada consolidates position due to improving performance measurement indices. Germany moves to ‘Highly Transparent’ tier. Poland moving towards ‘Highly Transparent’. Taiwan, Slovakia and Romania move into ‘Transparent’ tier. Japan jumps 7 places on back of improving market fundamentals data. Ghana, Nigeria and Pakistan move from ‘Opaque’ into ‘Low’. Debt crisis is having a negative effect in Puerto Rico. Transparent Semi-Transparent Low Transparency Transparent countries account for 20% of global real estate investment with high levels of investment intensity (investment relative to market size). They are home to 30% of global corporate HQs, have strong regulation and robust corporate governance. Home to a quarter of global corporate HQs (and growing), this group, dominated by large emerging markets, attracts 5–10% of global real estate investment. There is a disconnect between regulation and enforcement but growing middle classes are mobilising against corrupt practices. Highly Transparent Major Movers: Countries that saw the most significant changes in the past 2 years These highly liquid markets account for 75% of global real estate investment and are home to half of global corporate HQs. Some are moving towards new levels of transparency, aided by advancements in technology. ‘Development’ markets that are targets for corporates in Africa, Asia and South America. While corporate governance is generally weak, stronger regulation is being introduced and market tracking established. Technology advancements are set to enable this group to leapfrog normal evolution. Panama struggles to maintain transparency. Political and economic challenges weaken transparency in Lebanon, Mozambique and Venezuela. Myanmar among top global improvers, but from a low base. Opaque Dominated by African & Central American countries where geopolitical and economic challenges are constraining progress, these markets are characterised by limited regulatory framework, weak corporate governance with market data almost non-existent. To find out more about Real Estate Transparency and country ranks, visit: www.jll.com/transparency COPYRIGHT JONES LANG LASALLE IP, INC 2016 Slovenia, Serbia and Bulgaria are top global improvers. Saudi Arabia and Egypt nudge into ‘Semi-Transparent’. Regulatory reforms boost transparency in India. Vertical position is based on Transparency Rank: JLL’s Global Real Estate Transparency Index (2016) is based on: performance measurement, market fundamentals, governance of listed vehicles, regulatory and legal environment and the fairness of transaction processes. Bubble size is based on relative Real Estate Market Size: The estimated value of all institutionally-owned commercial real estate assets within a country Source: LaSalle Investment Management, latest year Asia PacificEurope MENA Sub-Saharan AfricaAmericas